
- 112
- 6 075 764
Data Tutorials
India
Приєднався 6 лют 2013
Welcome to the Data Tutorials Channel! 📊
🌟 Dive into the world of Data Analysis and beyond! 🌟
If you're passionate about Data Analytics and eager to master essential tools like Power BI, Tableau, SQL, Excel, Python, AWS, Azure, and more, you've come to the right place. Our channel is your go-to destination for in-depth tutorials and insights on all things data-related.
Join our ever-growing community of data enthusiasts, professionals, and learners. Whether you're a beginner or an experienced analyst, there's always something new to discover on Data Tutorials.
Subscribe now and hit that notification bell to stay up-to-date with our latest uploads. Let's unlock the power of data together!
Welcome aboard! 🚀📈 #DataTutorials #datanalytics #dataanalyst #powerbi #tableau #sql #excel #python #aws #azure #dashboard #datascience #portfolio #project
Power BI New Hot Features | May 2024 update | Power BI Tutorial 2024 | Power BI Updates
Power BI New Hot Features | May 2024 update | Power BI Tutorial 2024 | Power BI Updates
#powerbi #dataanalytics #datanalysis
Odin School PL 300 Certification Course - hubs.la/Q02zq-_60
Data and File Download - drive.google.com/drive/folders/1_FesPQCfHnw-hVi9lotHyqge0pthJWYg?usp=sharing
⭐For Important Data Analyst Materials and Projects visit my website - topmate.io/data_tutorials
📱Follow me on Facebook - profile.php?id=100095047697882&mibextid=ZbWKwL
📱 Follow me on LinkedIn - www.linkedin.com/in/swapnjeet-s-58a673273
⭐For Tableau, Power BI and Excel Projects contact me on my mail id or WhatsApp number mentioned at the end of description box.
➖➖➖➖➖➖➖➖➖➖➖➖➖
⭐Content
Introduction 00:00
Odin School 03:16
Matrix Layout 06:53
Line Updates 18:32
Modern Tool Tip 33:20
On Object Orientation 36:18
Publish to Folder 40:28
Copilot and Dax Copilot 43:00
New Manage Relationships Model 47:00
Outro 49:38
➖➖➖➖➖➖➖➖➖➖➖➖➖
Checkout my other videos on dashboards design in Tableau, Power BI and Excel below-
✅Data Modelling - ua-cam.com/video/JQ9wX1d7dGE/v-deo.htmlsi=RAxnrVsGOiQEwUgq
✅Data Cleaning - ua-cam.com/video/AWcmiyra7qs/v-deo.htmlsi=eYkqejnXeuZOkGea
✅Data Analyst Portfolio Projects - ua-cam.com/video/3Acmk-rqn6c/v-deo.html
✅Power BI Projects - ua-cam.com/video/-sOHVl_iCHA/v-deo.html
✅Tableau Projects - ua-cam.com/video/oAIubTqg-Kw/v-deo.html
✅Excel Projects - ua-cam.com/video/xHTUP1Dxu-M/v-deo.html
✅SQL Projects - ua-cam.com/video/4l7GgWmaTGc/v-deo.html
✅Power BI Interview Questions with Answers - ua-cam.com/video/bBYIvOytMwo/v-deo.html
✅Tableau Interview Questions with Answers - ua-cam.com/video/S7ArMgAdOIE/v-deo.html
=
➖➖➖➖➖➖➖➖➖➖➖➖➖
Reach out to me for any personal or Business related Dashboard/ Report development on my email- swapnjeet555@gmail.com
WhatsApp - +91 9579005495
Переглядів: 1 274
Відео
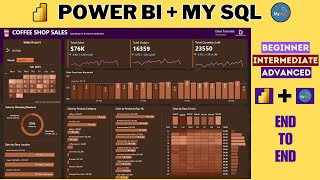

Power BI + My SQL Project | Power BI Project from start to end | Power BI tutorial 2024
Переглядів 18 тис.Місяць тому
#powerbi #mysql #dataanalytics Power BI My SQL Project | Power BI Project from start to end | Power BI tutorial 2024 Odin School PL300 Power BI Certification Course - hubs.la/Q02xXcNc0 ⭐For Important Data Analyst Materials and Projects visit my website - topmate.io/data_tutorials Data Download - drive.google.com/drive/folders/14sSwndELBWmfsBZc5E3dnc4VrgOCemcz?usp=sharing Welcome to this compreh...

MY SQL + Power BI Complete Project | End to End Power BI Project | Power BI tutorial | Part 1 | SQL
Переглядів 21 тис.Місяць тому
#powerbi #mysql #dataanalytics MY SQL Power BI Complete Project | End to End Power BI Project | Power BI tutorial | Sql Tutorial Part 2 - ua-cam.com/video/zMrmSctNCbE/v-deo.html ⭐For Important Data Analyst Materials and Projects visit my website - topmate.io/data_tutorials Welcome to this comprehensive Data Analyst Project tutorial! In this tutorial, I will guide you through the complete proces...

Power BI scenario based Interview Question with Solution | Power BI Interview | Power BI | #powerbi
Переглядів 2 тис.Місяць тому
#powerbi #interview #powerbitutorial Odin School Data Science Course Link - hubs.la/Q02w7fZB0 Power BI scenario based Interview Question with Solution | Power BI Interview | Power BI | #powerbi Power BI Scenario based interview questions with solution | Power BI interview | Power BI Part 1 - ua-cam.com/video/bBYIvOytMwo/v-deo.html Part 2 - ua-cam.com/video/qgf2P8JoGdI/v-deo.html Part 3 - ua-cam...
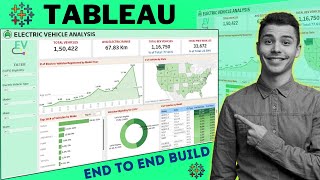
Tableau Full Project for Data Analysis | Start to End Tableau Dashboard Project
Переглядів 14 тис.2 місяці тому
#tableau #sql #powerbi Tableau Full Project for Data Analysis | Start to End Tableau Dashboard Project ⭐Data Download - drive.google.com/drive/folders/1YviyK5J_0LS9yBb2lNh2Fyap1xlyec7W?usp=sharing Welcome to this comprehensive Data Analyst Project tutorial! In this tutorial, I will guide you through the complete process of building a data analysis project using popular tools such as Power BI, T...
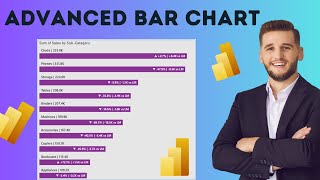
Power BI | Advanced Bar Chart | Custom Bar Chart | Power BI Tutorial #powerbi
Переглядів 2 тис.2 місяці тому
Power BI | Advanced Bar Chart | Custom Bar Chart | Power BI Tutorial #powerbi #dataanalysis Data Science Odin School Link - hubs.la/Q02tMRV30 Whether you are a beginner or an experienced data analyst, this tutorial will provide you with the necessary knowledge and hands-on experience to successfully complete a data analysis project. Join me on this journey and unlock the power of these essentia...

Power BI + MY SQL Project | Start to End | Coffee Shop Sales | Full Project | #powerbi #sql
Переглядів 4,5 тис.2 місяці тому
Power BI MY SQL Project | Start to End | Coffee Shop Sales | Full Project #powerbi #dataanalytics #sql Power BI Certification Course Link (Odin School) - hubs.la/Q02sQSDY0 For early access to this project, it is included in the "Power BI Complete Material - Edition 2024" on my website. The link to the website is - topmate.io/data_tutorials Welcome to this comprehensive Data Analyst Project tuto...

Data Analysis Complete Full Course | Data Analyst Portfolio Project | Start to End | Finance Domain
Переглядів 14 тис.3 місяці тому
#powerbidashboard #dataanalytics #dataanalysis Data Analysis Complete Full Course | Data Analyst Portfolio Project | Start to End | Finance Domain 📱Book 1:1 Call with me (Career Guidance, Mock Interviews, Resume Review, etc.) - topmate.io/data_tutorials 📱For Important Data Analyst Materials and Other Resources - topmate.io/data_tutorials 📱 Follow me on LinkedIn - www.linkedin.com/in/swapnjeet-s...

Tableau Complete Tutorial - Beginner to Pro | Project Based Learning | Edition 2024 #tableau
Переглядів 12 тис.3 місяці тому
#tableau #dataanalytics #dataanalysis In this 14 Hour high quality full Tableau course for beginners - Go from Beginner to Pro with Tableau! You're going to learn everything you need to get started with Tableau! This course covers all Tableau concepts and you will not only learn how to use Tableau but also you will understand ALL Tableau concepts and how Tableau works using Project Based Learni...
Power BI | New Feature | Visual Calculations | New Release | Power BI Tutorial 2024 | #powerbi
Переглядів 4,1 тис.3 місяці тому
#powerbi #dataanalytics #businessintelligence Start your career in Data Science with OdinSchool's Bootcamp. Apply Now : hubs.la/Q02h9SB50 OdinSchool's Data Science Bootcamp offers industry-aligned education at an affordable price. With a flexible 6-month duration, it accommodates your schedule and responsibilities. Here are some key highlights: 1. Live weekend classes and recorded lectures as w...
Power BI Complete Tutorial | Power BI Project | Bank Loan Analysis | Finance Domain #powerbi #sql
Переглядів 63 тис.4 місяці тому
#powerbi #sql #dataanalytics Power BI Complete Tutorial | Power BI Project | Bank Loan Analysis | Finance Domain #powerbi #sql Welcome to our comprehensive Power BI tutorial series! In this project, we delve into the Finance domain with a Bank Loan Analysis using Power BI and SQL. Follow along as we explore the ins and outs of Power BI, covering everything you need to know to master data visual...
Top Data Analyst Projects to get your DREAM JOB | Build IMPRESSIVE RESUME | Data Analyst Interview
Переглядів 7 тис.4 місяці тому
#datanalytics #powerbi #project Start your career in Data Science with OdinSchool's Bootcamp. Apply Now :hubs.la/Q02lVq5B0 OdinSchool's Data Science Bootcamp offers industry-aligned education at an affordable price. With a flexible 6-month duration, it accommodates your schedule and responsibilities. Here are some key highlights: 1. 360-degree Placement Assistance 2. Live weekend classes and re...
Power BI Dashboard Project | Power BI Tutorial for Beginners 2024 | Power BI Course
Переглядів 34 тис.4 місяці тому
Power BI Dashboard Project | Power BI Tutorial for Beginners 2024 | Power BI Course #powerbi #dataanalytics #datascience Welcome to this comprehensive Data Analyst Project tutorial! In this tutorial, I will guide you through the complete process of building a data analysis project using popular tools such as Power BI, Tableau, SQL, and Excel. Whether you are a beginner or an experienced data an...
Power BI - TCS & Wipro Most Important Interview Question | Power BI Interview 2024
Переглядів 3,7 тис.5 місяців тому
Power BI - TCS & Wipro Most Important Interview Question | Power BI Interview 2024
Power BI Project From Start to End Part 2 | Car Sales | Advanced DAX | End to End |2024 #powerbi
Переглядів 21 тис.5 місяців тому
Power BI Project From Start to End Part 2 | Car Sales | Advanced DAX | End to End |2024 #powerbi
Power BI Project From Start to End Part 1 | Car Sales | Advanced DAX | End to End |2024 #powerbi
Переглядів 42 тис.5 місяців тому
Power BI Project From Start to End Part 1 | Car Sales | Advanced DAX | End to End |2024 #powerbi
Your Role as a Data Analyst | What Data Analyst Actually do?| Roles & Responsibilities| 2024#powerbi
Переглядів 7 тис.5 місяців тому
Your Role as a Data Analyst | What Data Analyst Actually do?| Roles & Responsibilities| 2024#powerbi
Power BI Scenario Based Questions with Solution | Most Asked Interview Questions | #powerbi
Переглядів 5 тис.6 місяців тому
Power BI Scenario Based Questions with Solution | Most Asked Interview Questions | #powerbi
Tableau + SQL Project | Data Analyst Portfolio Project | Beginner to Advanced | Start to End Build
Переглядів 44 тис.6 місяців тому
Tableau SQL Project | Data Analyst Portfolio Project | Beginner to Advanced | Start to End Build
Excel Project | Data Analyst Portfolio Project | Finance Domain | Start to End | For Beginners | #2
Переглядів 56 тис.7 місяців тому
Excel Project | Data Analyst Portfolio Project | Finance Domain | Start to End | For Beginners | #2
Data Analyst Portfolio Project | Finance Domain | Start to End | For Beginners | Part 1
Переглядів 31 тис.7 місяців тому
Data Analyst Portfolio Project | Finance Domain | Start to End | For Beginners | Part 1
Financial Domain | Data Analyst Portfolio Project | Overview | Beginner to Advanced | #powerbi #sql
Переглядів 10 тис.8 місяців тому
Financial Domain | Data Analyst Portfolio Project | Overview | Beginner to Advanced | #powerbi #sql
Build a Power BI Dashboard in 70 min | Power BI Project | End to End | Beginner to Pro | #powerbi
Переглядів 75 тис.8 місяців тому
Build a Power BI Dashboard in 70 min | Power BI Project | End to End | Beginner to Pro | #powerbi
Create a Data Analyst Portfolio Site | Build Powerful Resume | Power BI Portfolio
Переглядів 30 тис.9 місяців тому
Create a Data Analyst Portfolio Site | Build Powerful Resume | Power BI Portfolio
Data Analyst Portfolio Project | Power BI + SQL + Tableau + Excel | For Beginners |End to End
Переглядів 34 тис.9 місяців тому
Data Analyst Portfolio Project | Power BI SQL Tableau Excel | For Beginners |End to End
Tableau Project | Data Analyst Portfolio Project | Start to End | For Beginners | #tableau
Переглядів 30 тис.9 місяців тому
Tableau Project | Data Analyst Portfolio Project | Start to End | For Beginners | #tableau
Power BI Scenario based interview questions with solution | Power BI interview | Power BI |#powerbi
Переглядів 17 тис.9 місяців тому
Power BI Scenario based interview questions with solution | Power BI interview | Power BI |#powerbi
Top 10 SQL Interview Questions and Answers | SQL Interview Questions 2023 | #sql
Переглядів 11 тис.10 місяців тому
Top 10 SQL Interview Questions and Answers | SQL Interview Questions 2023 | #sql
Data Cleaning in Power BI | Power Query | ETL | Complete Tutorial 2023 | For Beginners | #powerbi
Переглядів 30 тис.10 місяців тому
Data Cleaning in Power BI | Power Query | ETL | Complete Tutorial 2023 | For Beginners | #powerbi
Tableau & SQL Project | Data Analyst Project | Start to End | For Beginners | #tableau #sql
Переглядів 79 тис.10 місяців тому
Tableau & SQL Project | Data Analyst Project | Start to End | For Beginners | #tableau #sql
data set
God bless you, man. You're amazing! The tutorial is super simple and easy to follow Must have taken a lot of effort. Many thanks! 🙏
ua-cam.com/video/3R7eshUBhfY/v-deo.html
couldn't download your file , i used another dataset. my question is , what if it doesn't have accident date? what should i use? Number of causalities?
Thanks for such content sir
This is an awesome presentation
How to load data quickly in my sql
I'm applying for a jpg format image and when I apply background image , the jpg format shows white background, disturbing the whole box, what should I do?
close your channel i have fired total_Sales query 10 time and asked chatgpt but not get correct answer answer is null
Thanks a lot .❤ sir.. In the max date received parameter - there s show only current value..not show that max date received calculated field... Could u please reply?? What to do?
Sir , what is impact of this project could you explain it ?
Sir , what is impact of this project could you explain it ??
I made this project and I want to share on your linkedin profile, so please share your link
Thank u bhaiyya❤
2:38:31
I used to forget projects what I have done and learned from it when I was doing python ML projects, until i started taking notes using this extension onebook, till date i found it the most easiest way to save your learning chromewebstore.google.com/detail/onebook/loecbgjbgcgjkhibllnjokjefojoheim?RX0ehXijbSk
Can we make analysis dynamics with changes in data/graph?
Yes you can use your own imagination and design
My friend, explain me something. i'm learning from your channel, but how a begginers can create by himself this dax formula? MoM Growth & Difference Sales = VAR month_diff = [CM Sales] - [PM Sales] VAR mom = DIVIDE([CM Sales] - [PM Sales], [PM Sales]) VAR _sign = IF(month_diff > 0, "+", " ") VAR _sign_trend = IF(month_diff > 0, "▲", "▼") RETURN _sign_trend & " " & _sign & FORMAT(mom, "#0.0%") & " | " & _sign & FORMAT(month_diff / 1000, "0.0K") & " vs LM" 1) Just explain me how, because it's very hard to understand. are you using chatgpt? for example if a company asks you for this specific measure, you take in advange usign chatgpt or you create this formula by yourself without help?? 2) all the case study that you're publishing in your channel they could be considerated as real case or not? Thanks for your work.
First of all these are projects with data available on kaggle or any other website. The requirements are created by myself based on my 10+ years of experience in this field. When you create requirements and based on that you create these logic, and I have not used chat gpt. I have gained enough experience in DAX that I can create these set of logics by myself. In realtime requirements and data come from clients, which are somewhat similar as these.
@@datatutorials1 I KNOW, but i don't have your experience, how can i work for a company if i don't have this padronance with dax?? i do practice every day, but i don't have much confidence with dax, you know what i mean? i can use chat gpt for learning fast? whatsapp the big advice for a begginners like me? thanks a lot, you're the best.
@s.s616 you have to work on such projects, create your own reports. Practice will only make u perfect. Even I didn’t had much knowledge when I started to work in this field. You have to work on multiple scenarios. Building and practising 2 or 3 projects won’t get u to this level of understanding. Work as much as you can on such projects, then and then u will gain knowledge and confidence.
@@datatutorials1 if I follow all your project's tutorial, I will able in some moth to understand a lot? Just to have the necessary skills to send a CV to some companies. What do you think?
This is amazing! I am gonna follow all of your dashboard tutorials!
The data set you provided can't be edited it shows it is protected
Thank you for this amazing portfolio project which will be truly helpful for mine data analyst journey. I just completed this amazing video, and I must appreciate your time & efforts behind such a great work which shows the real industry experience behind it. Glad to subscribe your channel. Much Appreciated!
hy there, max point measure is not getting accepted in y axis of area table what might be the reason. dax used "Max Point = IF(MAXX(ALLSELECTED('Calendar table'[Week]),[Total Sales])=[Total Sales],MAXX(ALLSELECTED('Calendar table'[Week]),[Total Sales])=[Total Sales],BLANK())"
Thank you so much Sir for such an amazing content. Since 11:30 PM to 12:00 PM(Midnight to Midday), this 4 hour video took more than 12 hours but it definitely boost my confidence in Power BI.
You are really doing great job.
thank you
not ablr to import the data only 384 rows are being imported
thanks i got many ideas for my final project
Hello there, if you are calculation YOY growth is it the same timeframe from YTD and PYTD?
How to create dashboard backgrounds?
A simple donut chart could have been used to visualize the BEV and other type of vehicles. why to create two different donut charts?
the link to download data is not working
WHAT ARE THE INSIGHTS WE got .....can anyone can help me
I “PARTICULARLY” liked this video❤
I got that, thats in my every sentence 😅
@@datatutorials1 But great dashboard, I am halfway done.....
That was the easiest explanation I ever had. Thanks for this video.
please i need link to download the data, can't download it with the one one the page
Infact you are the best i love this
i am solving this with ipl 2008-2024 data. when I calculate orange cap holder, it shows batter name of latest season when slicer is at all settings. for eg: when slicer is at all, it will show virat kohli as per latest season, but when I calculate total runs, the card visual shows total scores/runs of all seasons for virat kohli. but I want it to show total runs of latest season only when slicer is at all selection. just like you have shown here. how to achieve
sir atleast you should tell about the data in detail you always focus on dashboard you never focus on the data which is very wrong
Data is explained, what explanation you need more, please suggest and I will add that in next video
Less is better but it’s cool though
Too much information makes it difficult
I would request you to put your videos in their specific playlist. Seems some of the videos are not organised.
i was struggling trying to understand why can't a simple calculate function (check year and match_no = "Final" and return the match winner) be used instead of finding max date of a particular season to find out the title winner. is there a reason you chose the second option?
This is a much simpler formula and it works but the problem is that it won't show the latest season winner if all years are selected. is there any fix for this? Title Winner = CALCULATE(SELECTEDVALUE(Matches[Winning_Team]),YEAR(Matches[Match_Date]),Matches[Match_No]="Final")
why did u use sql if u can use DAX
Novy pro had stopped genareting free service account.. what to do bro.. any alternative
According to the statement problem, In loan status grid view, it was also asked about the MTD funded and recieved amount. I think u missed out on adding it to the first dashboard
Thank you so much for this amazing tutorial, I've learnt a lot from your videos. I have a question, in 1:33:18 you placed KPIs in Dashboard, and let's say I wanna highlight the first KPI only which is "Total Revenue - $817.9K" so how to change the color only for the first KPI? when I change the color it changes all the color for other KPIs as well, I have tried a lot and couldn't find the solution for this. Another question, how to manually create customised filter action? Let me explain, In 2:40:00 you placed a Pizza Category drop down filter, if I choose a 'classic' from that drop down filter the "Total Orders" shows 10.9K I want it to show the number that I choose lets say 15.5K but not 10.9K? and also for other category as well, if I choose veggie it should show the number that I want.
Thank you for another highly informative portfolio project. Great presentation